


Best 10 KPIs for Software Development (2026 Guide)
Engineering leaders don’t usually struggle to find metrics, they struggle to find KPIs for software development that (1) reflect reality, (2) align with product goals, and (3) don’t turn into a weekly reporting tax.
In 2026, the bar is higher: faster release cycles, more automation, and AI-assisted coding mean you can ship more yet still miss the outcomes your business cares about (reliability, adoption, customer trust, and team sustainability). The answer isn’t “track everything.” It’s to track a small, balanced set of software development performance metrics that connect delivery speed, quality, and impact.
This guide gives you a board-ready set of the best 10 KPIs for software development, including what each KPI means, how to calculate it, where to pull the data from, and what behaviors it can accidentally incentivize (so you can prevent gaming).
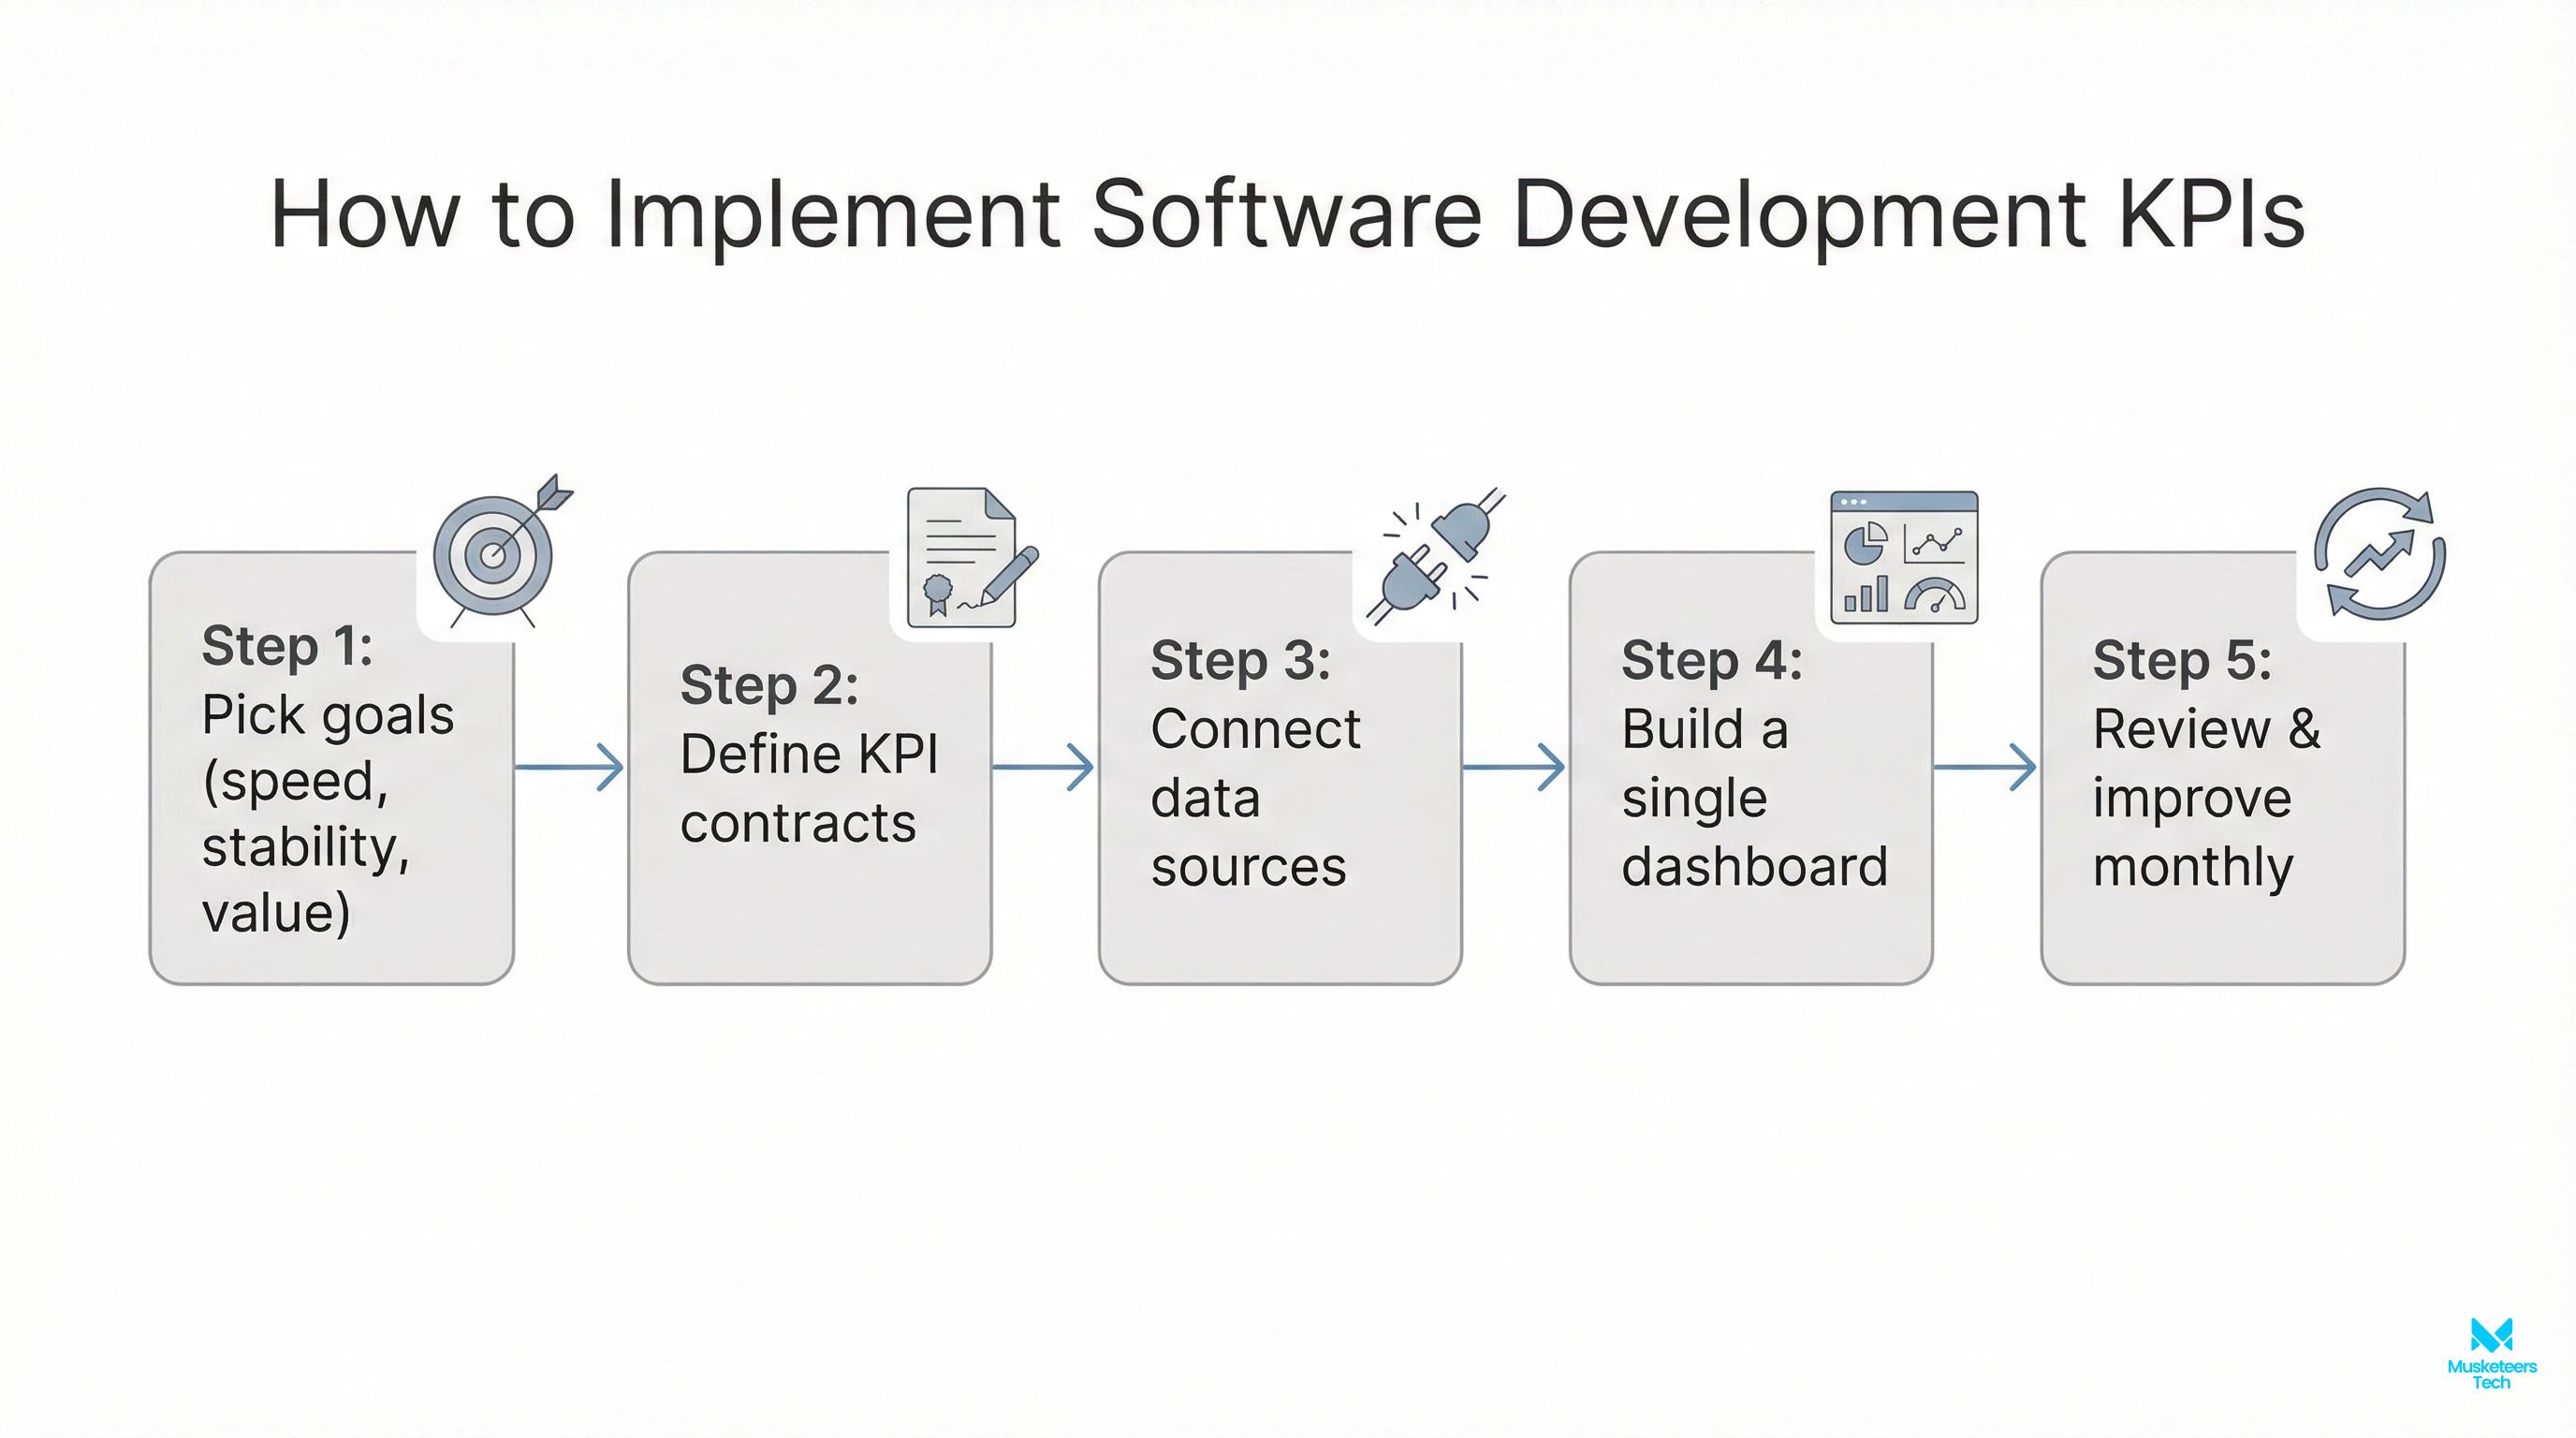
How to make KPIs actually work
KPIs have two layers: - Visible outcomes: speed, quality, impact. - Hidden foundations: clear definitions, automated data sources, anti-gaming guardrails, and a steady review cadence with accountable owners.
What Are KPIs for Software Development? (Definition + Scope)
KPIs (Key Performance Indicators) for software development are measurable signals that show whether your engineering system is healthy and improving. A KPI is not just “a metric we can measure.” It’s a metric tied to a decision.
A good KPI for developers and teams usually has three properties:
- Actionable: you can change it with process, tooling, or staffing decisions.
- Comparable over time: trends matter more than single snapshots.
- Hard to game: or at least paired with a “counter-metric” to keep behavior balanced.
A practical way to think about software metrics is by who uses them:
- Team-level KPIs: used in retros and sprint planning (flow, quality, predictability).
- Leadership KPIs: used for investment decisions (capacity mix, reliability, delivery capability).
- Product/business KPIs: used to validate ROI (adoption, customer issues, revenue impact).
If you want a deeper Agile baseline, start with what Agile software development is.
Why KPIs for Software Development Matter (Benefits + Outcomes)
Tracking engineering KPIs matters because it turns opinions into repeatable decisions especially when priorities collide (ship faster vs reduce defects vs protect focus time).
- Reduce delivery risk: find bottlenecks early (WIP swelling in QA, review queues piling up).
- Improve reliability: watch MTTR and change failure rate, not just “uptime.”
- Make planning credible: forecast using cycle time and predictability, not gut feel.
- Protect team health: pair speed metrics with stability and friction signals.
- Prove business impact: connect delivery to adoption and customer-reported issues.
The Best 10 KPIs for Software Development (With Formulas & Pitfalls)
Below is a balanced set of 10 software development KPIs you can implement without turning into a spreadsheet company. If you can only start with 5, choose #1-5 first.
1) Cycle Time (Delivery Speed)
- What it measures: How long work takes once it starts (from “in progress” to “done”).
- Why it matters: Shorter cycle time usually means faster learning and less work aging in queues.
Formula:
- Cycle Time = Done date - Start date
Data sources: Jira/Linear status changes, Git PR timelines, CI/CD pipeline timestamps.
Pitfall: Teams may split work into tiny tickets to “look fast.”
- Guardrail: Pair with escaped defects (#6) and feature adoption (#10).
2) Lead Time for Changes (Speed to Customer Value)
- What it measures: Time from code committed (or change requested) to running in production.
- Why it matters: Core DORA metric that correlates with high-performing delivery systems.
Formula (DORA-style):
- Lead Time for Changes = Production deploy time - First commit time
Data sources: Git + CI/CD + deployment logs.
Pitfall: If “done” doesn’t mean “shipped,” lead time gets distorted.
- Guardrail: Define “in production” clearly and keep the definition stable for 6-12 months.
External reference: State of DevOps research (DORA)
3) Deployment Frequency (Release Cadence)
- What it measures: How often you deploy to production.
- Why it matters: Frequent, smaller releases reduce batch-size risk and speed feedback loops.
Formula:
- Deployment Frequency = # of production deployments / time period
Data sources: GitHub Actions, GitLab CI, CircleCI, deployment platform logs, Kubernetes events.
Pitfall: High frequency without stability can harm customers.
- Guardrail: Pair with change failure rate (#4).
4) Change Failure Rate (Release Stability)
- What it measures: Percentage of deployments that cause incidents, rollbacks, or hotfixes.
- Why it matters: It’s the “quality tax” of moving fast.
Formula:
- Change Failure Rate = Failed deployments / Total deployments
Data sources: Incident tools (PagerDuty), release annotations, rollback counts, postmortems.
Pitfall: Under-reporting incidents to keep CFR “pretty.”
- Guardrail: Use objective signals (rollback, error budget burn, incident tickets) and blameless reporting.
5) MTTR (Mean Time to Restore/Recover)
- What it measures: How quickly you restore service after an incident.
- Why it matters: Customers forgive outages faster than they forgive slow recovery and poor communication.
Formula:
- MTTR = Average(restore time - incident start time)
Data sources: PagerDuty/Opsgenie, status page events, observability tools (Datadog/New Relic).
Pitfall: “Stopping the clock” early with temporary workarounds.
- Guardrail: Track time to mitigate and time to fully resolve.
6) Escaped Defects (Defect Escape Rate)
- What it measures: Bugs found after release (by users, support, or production monitoring).
- Why it matters: Captures real-world quality, not just test-suite confidence.
Formulas:
- Escaped Defects = # of defects reported after release (per release or per month)
- Defect Escape Rate = Escaped defects / Total defects
Data sources: Support tools (Zendesk), bug trackers, post-release incident tags.
Pitfall: Raw counts punish high-risk areas.
- Guardrail: Segment by severity and normalize per active users or requests where appropriate.
7) Time to Resolution for Bugs (Customer Pain Duration)
- What it measures: How long reported issues stay unresolved.
- Why it matters: Bug count is noisy; duration reflects customer impact and responsiveness.
Formula:
- Bug Resolution Time = Closed date - Reported date
Data sources: Jira, support tickets, incident tracker.
Pitfall: Premature ticket closures.
- Guardrail: Track reopened rate or “repeat issue” occurrences.
8) Work In Progress (WIP) + Flow Efficiency (Throughput Health)
- What it measures:
- WIP: how many items are actively being worked on
- Flow efficiency: percentage of time work is actively progressing vs waiting
- Why it matters: Excess WIP is a leading indicator of thrash, context switching, and slow delivery.
Formulas:
- WIP = # items in active statuses
- Flow Efficiency = Active time / (Active time + Waiting time)
Data sources: Kanban boards, Jira status timestamps, PR review queues.
Pitfall: Hiding work in untracked channels.
- Guardrail: Make workflow visible and lightweight; don’t punish the metric.
9) Sprint Predictability (Plan-to-Done Ratio)
- What it measures: How reliably the team completes what it commits to in a sprint.
- Why it matters: Improves forecasting and reduces stakeholder churn.
Formula:
- Predictability = Completed committed work / Total committed work
Data sources: Sprint boards, sprint reports.
Pitfall: Sandbagging commitments to hit the number.
- Guardrail: Pair with cycle time trend (#1) and retro questions: Did we learn and deliver value?
10) Feature Adoption Rate (Business Impact KPI)
- What it measures: Whether shipped functionality is actually used.
- Why it matters: Closes the loop from “we delivered” to “customers benefited.”
Formula example:
- Feature Adoption = Active users using feature / Eligible active users
Data sources: Amplitude, Mixpanel, PostHog, event logs.
Pitfall: Low adoption may be discoverability, not engineering.
- Guardrail: Treat as cross-functional KPI (product + design + engineering).
DORA vs SPACE vs DevEx: Which KPI Framework Should You Use?
If you’ve been researching metrics in software engineering, you’ll see three frameworks referenced often. Here’s how to use them without turning your org into a metrics debate club.
| Framework | Best for | What it includes | What it can miss |
|---|---|---|---|
| DORA | Delivery + reliability | Lead time, deploy frequency, CFR, MTTR | Team health and product impact |
| SPACE | Balanced productivity view | Satisfaction, Performance, Activity, Communication, Efficiency | Can become too broad without a “starter set” |
| DevEx | Developer experience | Friction, feedback loops, cognitive load, tooling pain | Needs strong instrumentation and survey design |
A practical approach for most teams:
- Use DORA as your baseline (KPIs #2-5).
- Add flow + predictability (#1, #8, #9) so you can improve the system, not just report it.
- Add impact (#10) so shipping doesn’t become the goal.
External reference: SPACE framework (ACM Queue)
Best Practices & Common KPI Mistakes (Avoid Vanity Metrics & KPI Traps)
Most KPI failures aren’t caused by bad math. They’re caused by bad incentives.
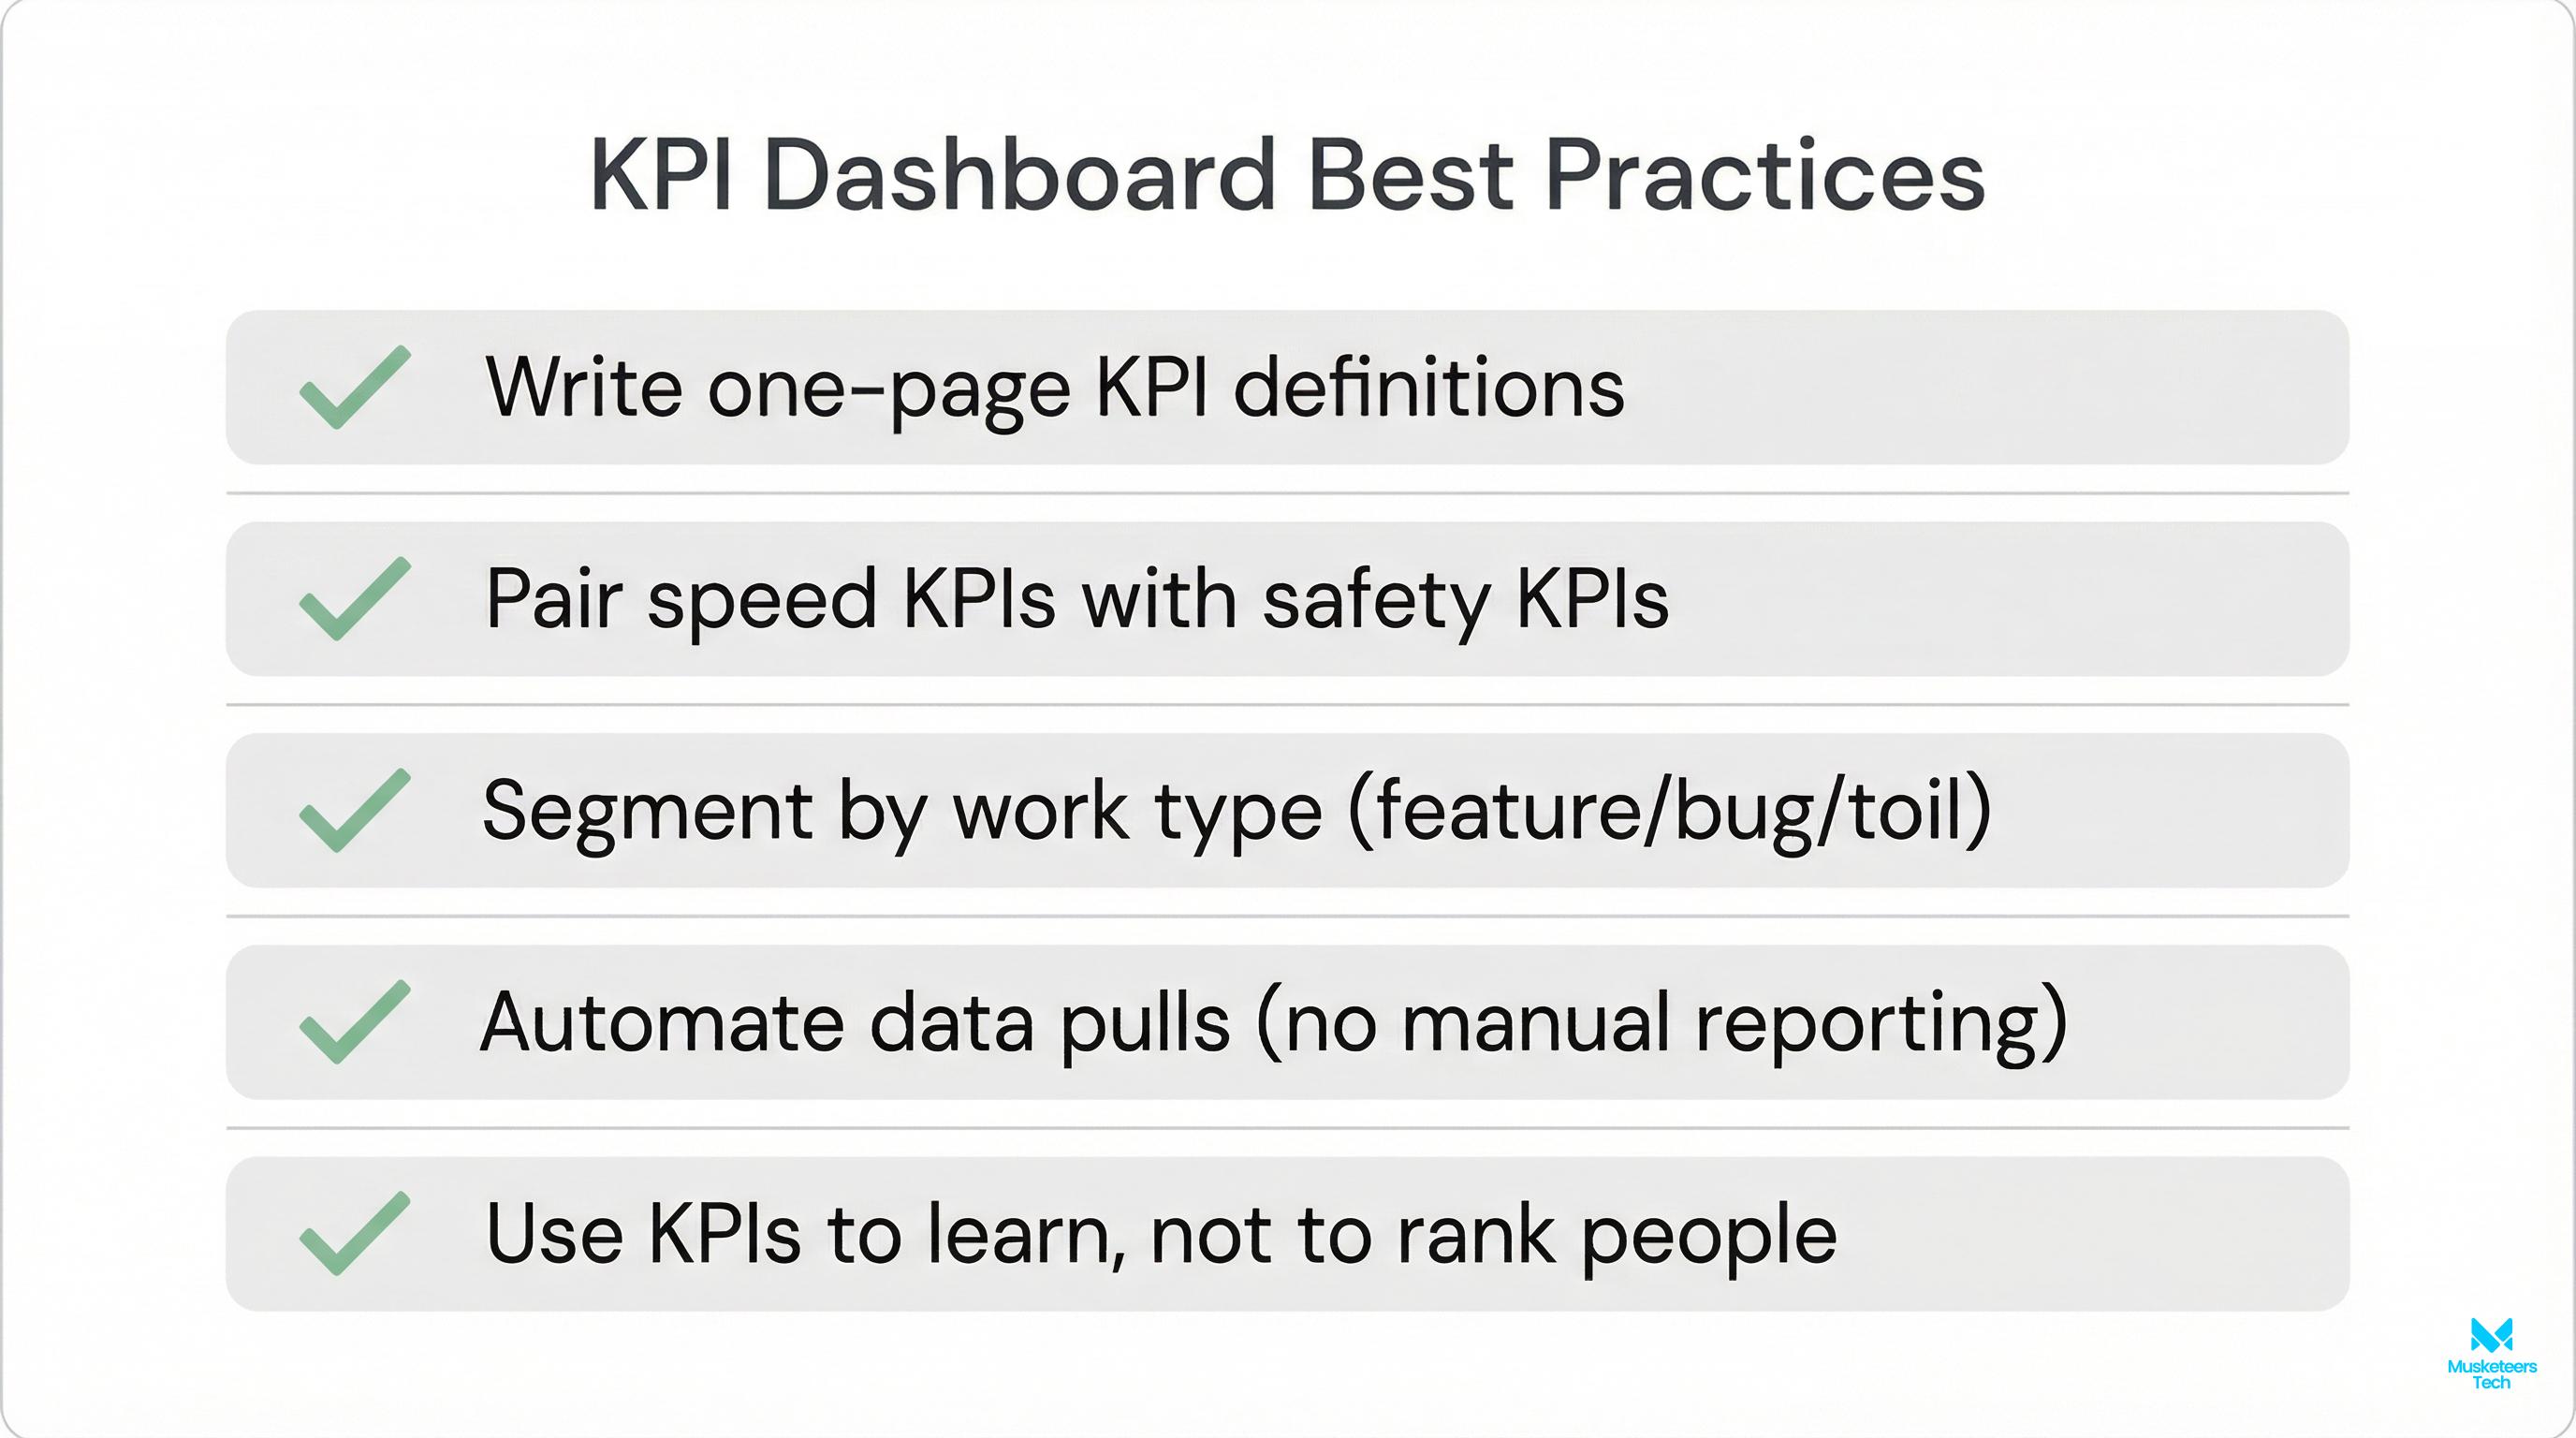
Best practices that actually stick
- Define each KPI in one sentence and freeze it for a quarter.
- Assign an owner who makes decisions, not a “reporting person.”
- Review on cadence: weekly (team), monthly (leadership), quarterly (business impact).
- Pair speed with stability metrics.
- Use trends, not leaderboards; context matters across teams.
Common mistakes to avoid
- Lines of code, commit count, PR count as performance KPIs.
- Ranking teams by story points (not comparable across squads).
- One dashboard for all team types (platform vs product vs infra differ).
- Manual collection (dies silently after a few weeks).
For a project-management oriented KPI set, see these essential KPIs for development teams.
Tools & Dashboards: How to Track Software Metrics Without Manual Work
To track KPIs for software development consistently, aim for instrumentation over reporting. Typical data sources:
- Planning/work tracking: Jira, Linear, Azure DevOps
- Code + review: GitHub, GitLab, Bitbucket
- CI/CD + deploy: GitHub Actions, GitLab CI, CircleCI, ArgoCD
- Incidents + on-call: PagerDuty, Opsgenie, Statuspage
- Observability: Datadog, New Relic, Grafana/Prometheus
- Product analytics: Amplitude, Mixpanel, PostHog
- Dashboards: Looker, Power BI, Grafana, Metabase
A simple KPI dashboard layout that works:
- Top row: DORA (lead time, deploy frequency, CFR, MTTR)
- Middle: flow (cycle time, WIP/flow efficiency, predictability)
- Bottom: quality + impact (escaped defects, time to resolve, adoption)
Tip
Automate data collection from your toolchain. If a metric requires manual updates, it will be stale or abandoned within weeks.
Frequently Asked Questions (FAQs)
It’s a heuristic that says successful delivery is often driven by 40% people, 20% process, and 40% tools/technology (variants exist). The takeaway: don’t try to “tool your way out” of misalignment. Balance team capability, workflow, and automation.
How Musketeers Tech Can Help
If you’re trying to operationalize KPIs for software development, the biggest blocker is rarely “we don’t know which metrics to pick.” It’s usually one of these: unclear definitions, missing instrumentation, or dashboards that don’t map to decisions.
At Musketeers Tech, we help teams design a lightweight measurement system that connects engineering delivery to business outcomes without creating manual reporting overhead. That typically includes:
- KPI definition workshops (what to measure, how to segment, anti-gaming guardrails)
- Toolchain integration (Jira/Git/CI/CD/observability → unified dashboard)
- Operating cadence (weekly team review, monthly exec readout, quarterly KPI refresh)
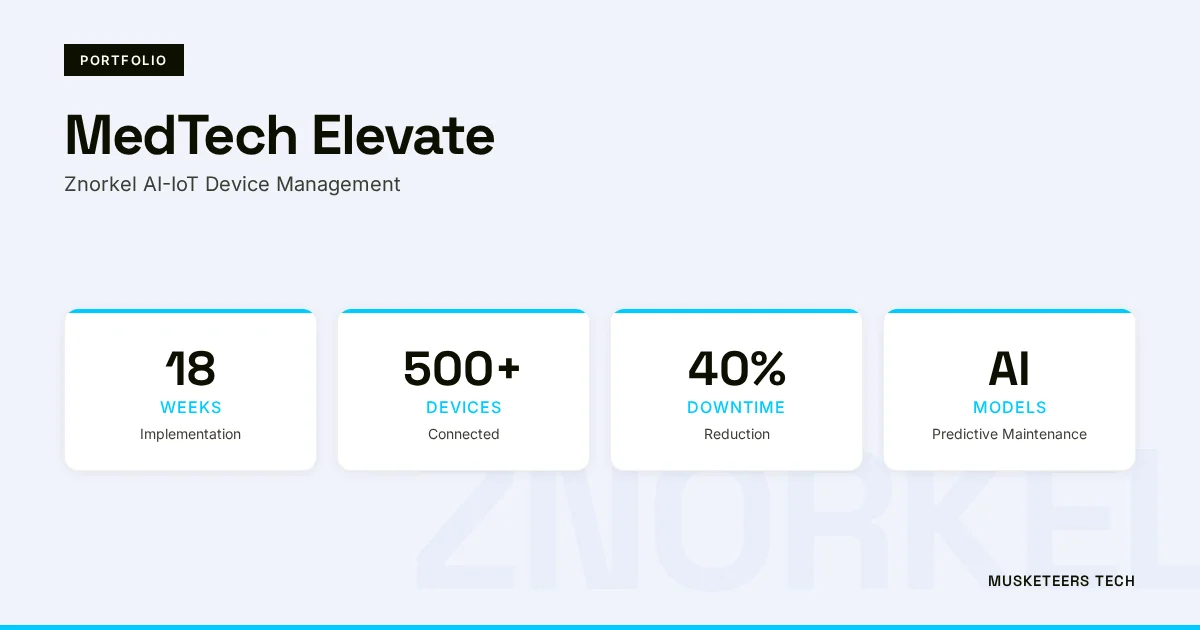
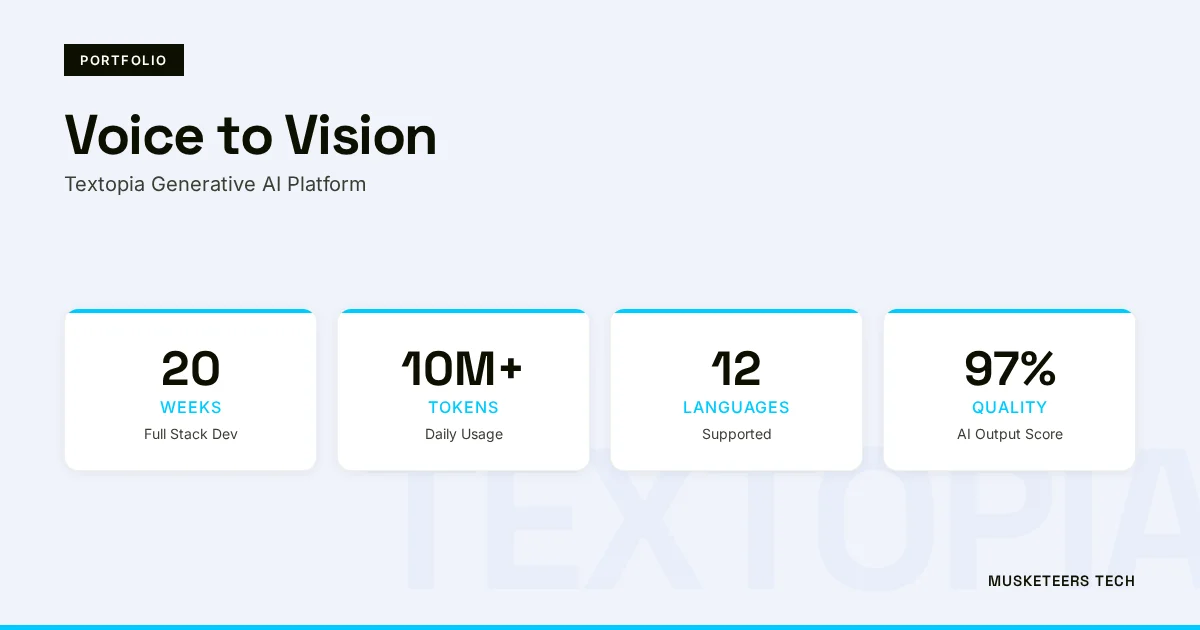
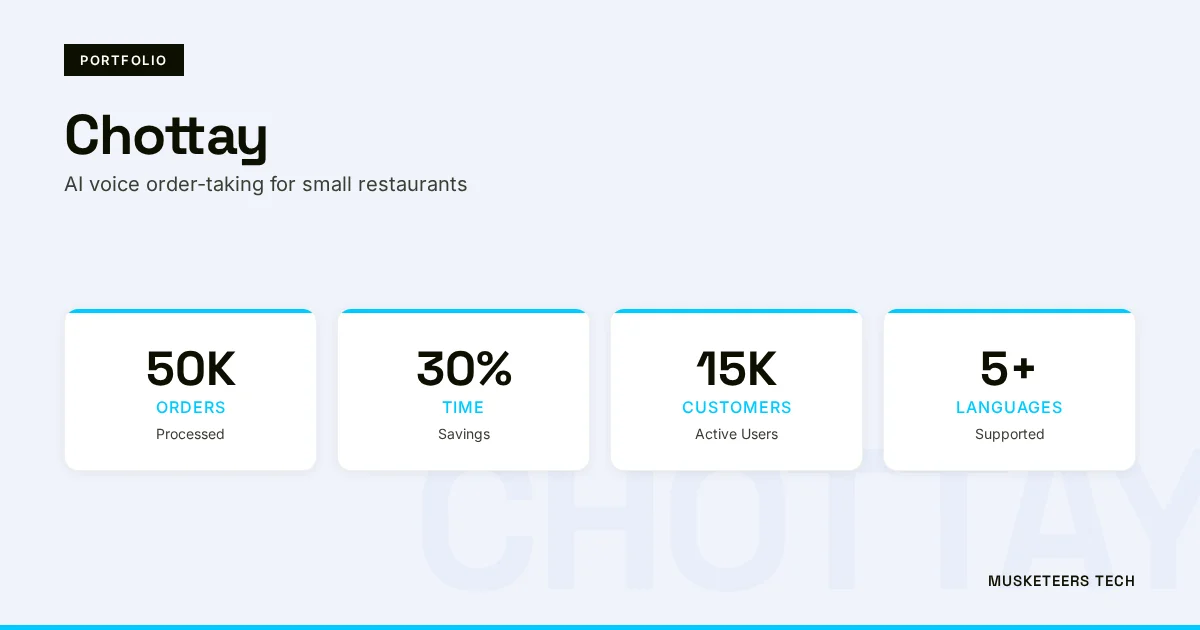
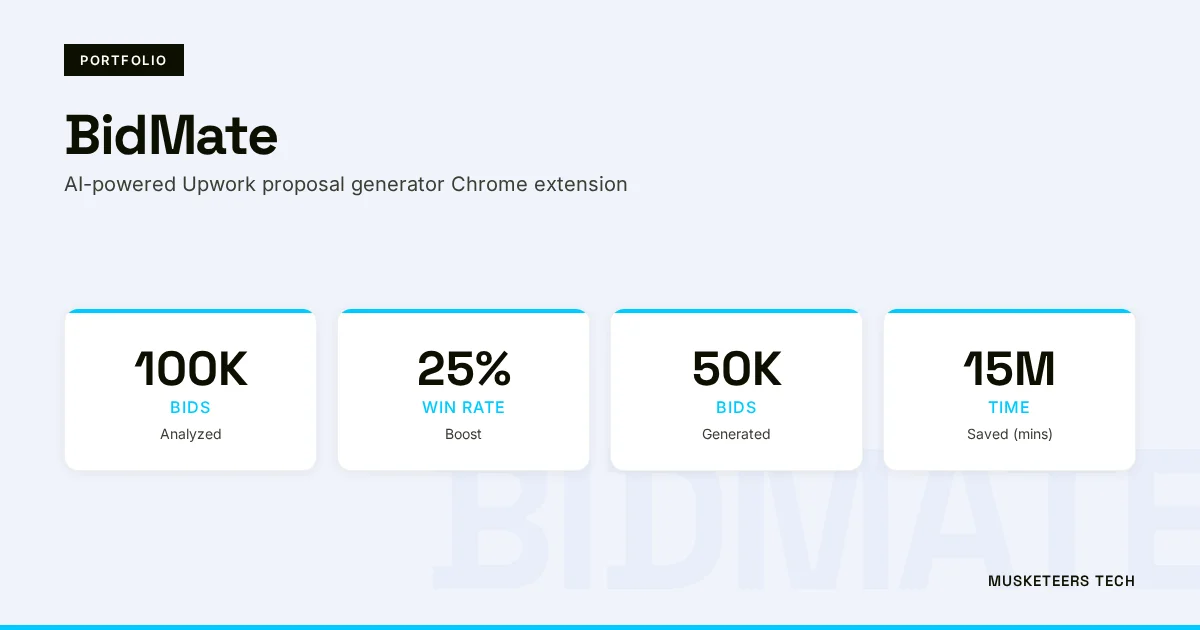
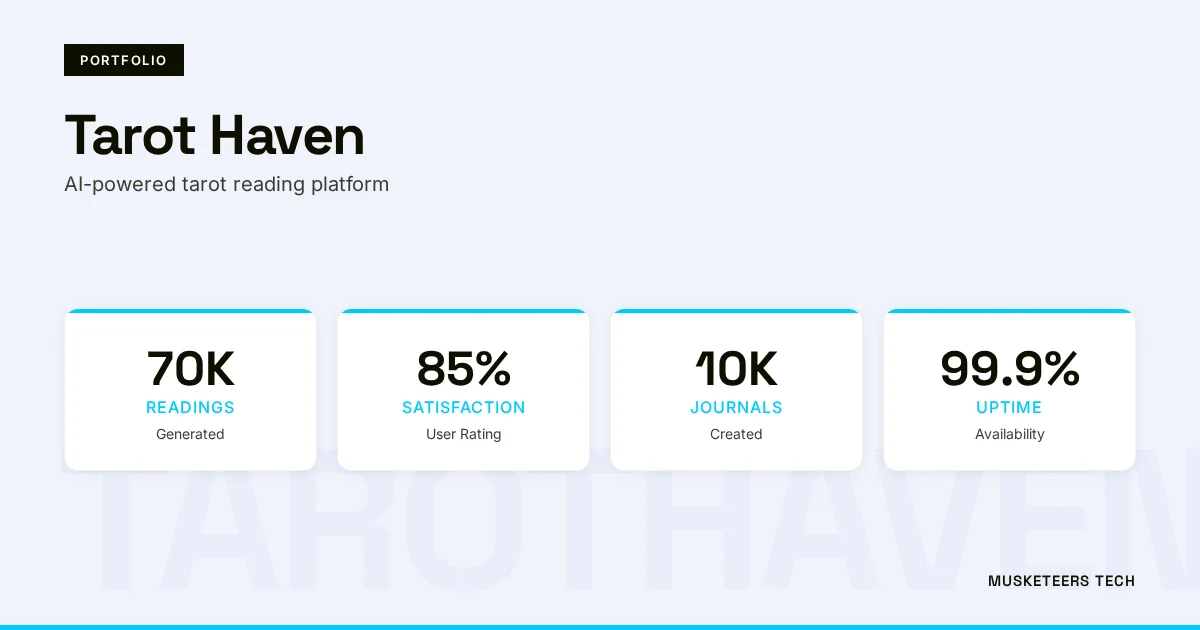
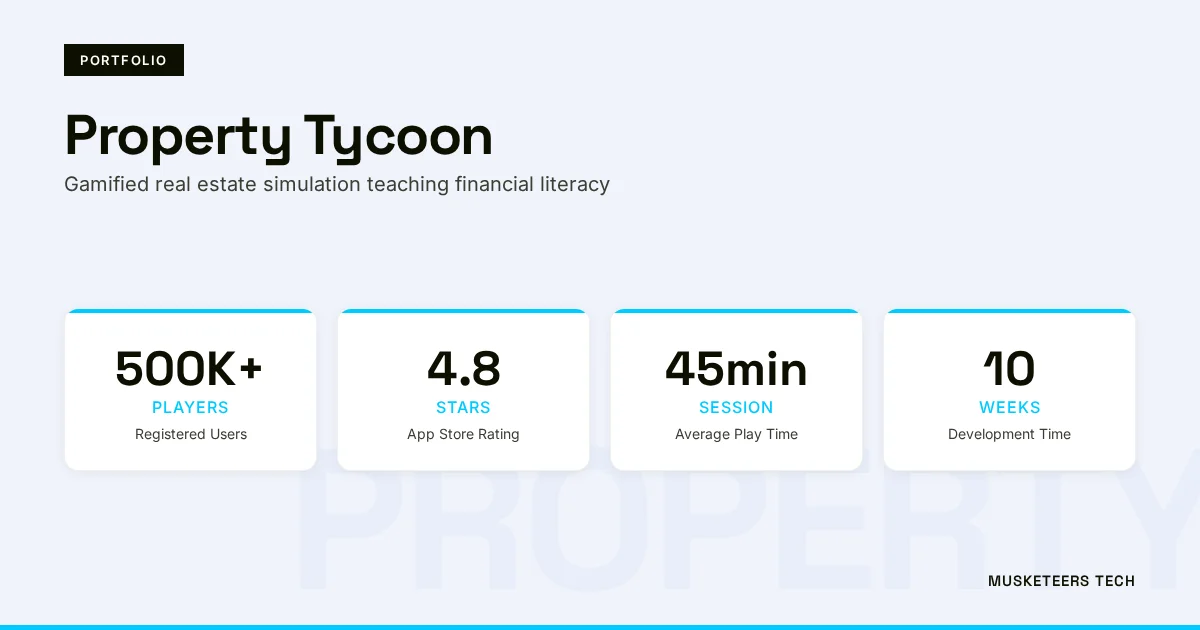
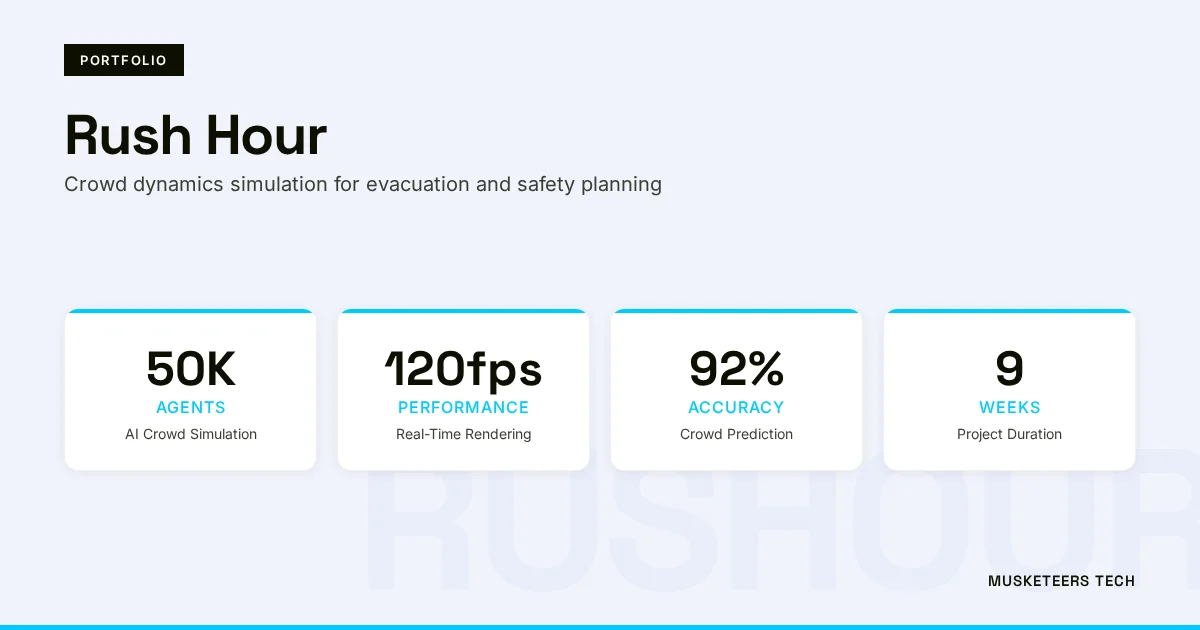
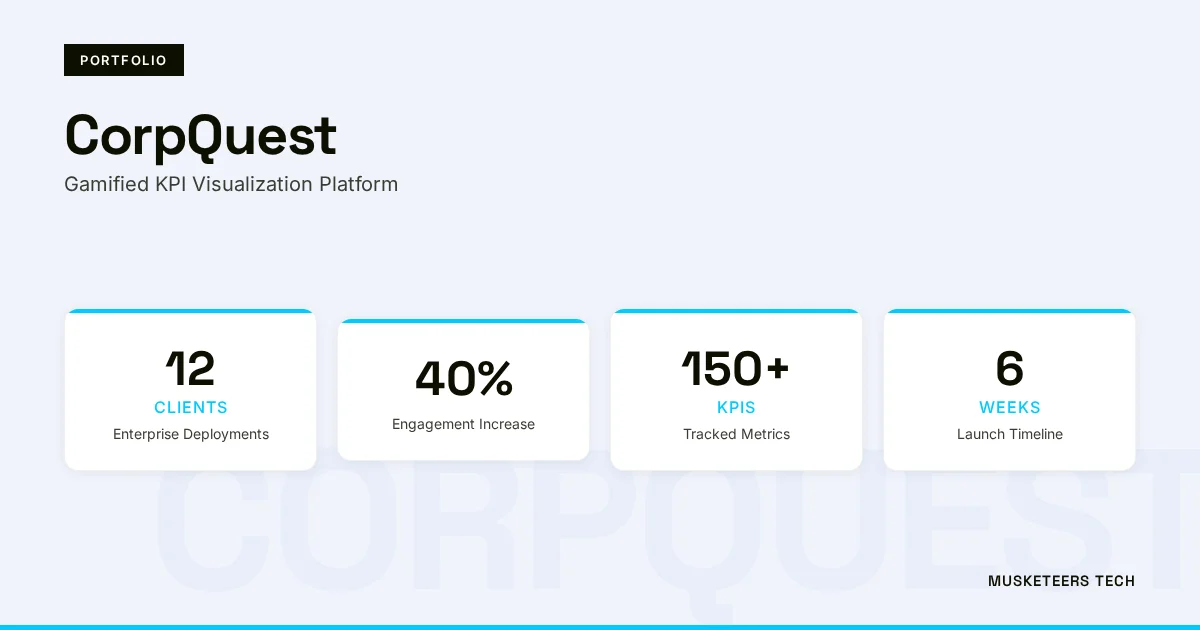
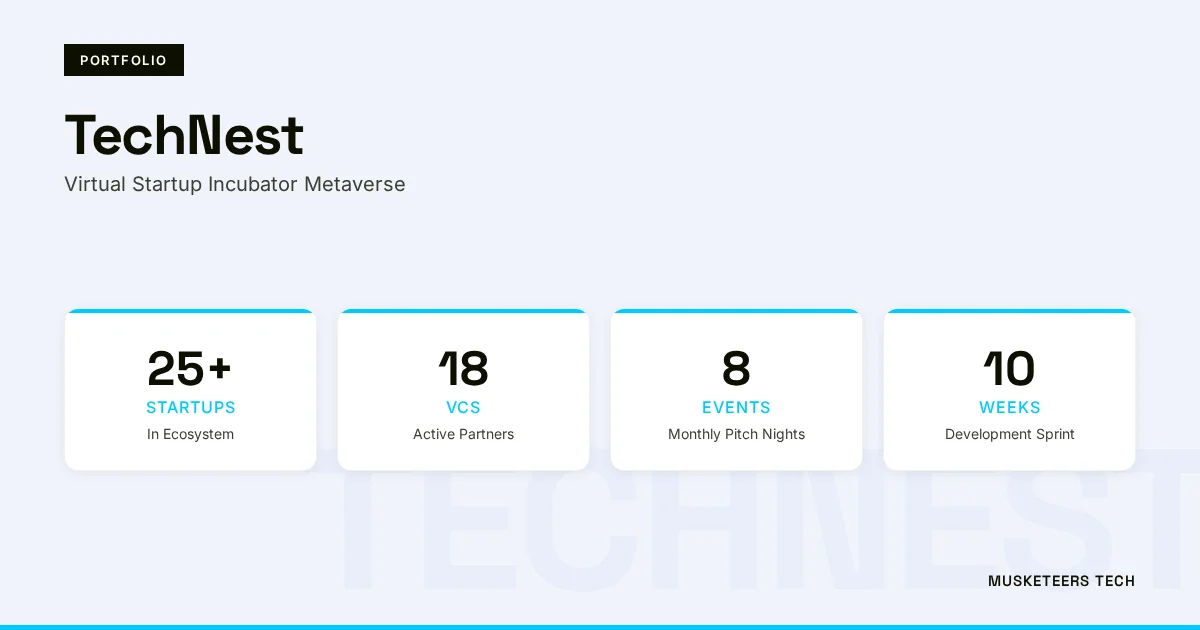
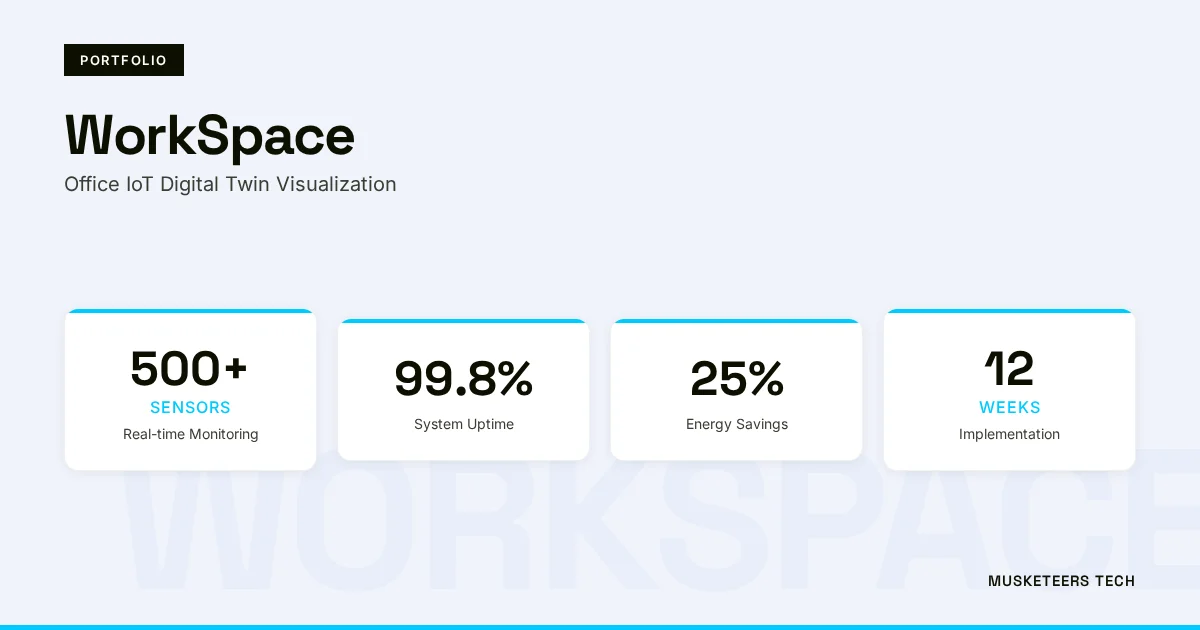
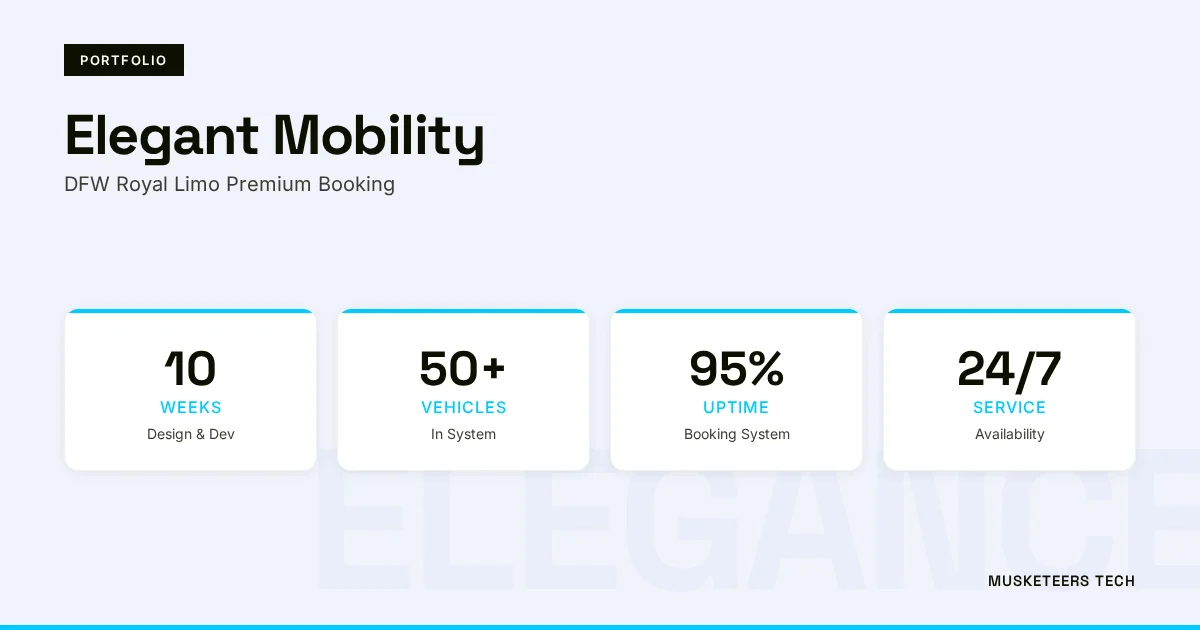
We’ve built and scaled data-driven products in our portfolio, where delivery speed, reliability, and adoption metrics directly impacted growth.
Software Strategy Consulting
Design a KPI system that aligns engineering delivery with business outcomes.
CTO as a Service
Set up your engineering operating cadence, dashboards, and review rituals.
Final Thoughts
The best 10 KPIs for software development aren’t the ones with the fanciest dashboards. They’re the ones your teams trust, your leaders use, and your customers benefit from. Implement this balanced set to gain clarity across delivery speed (cycle time, lead time, deployment frequency), operational reliability (CFR, MTTR), product quality (escaped defects, bug resolution time), flow health (WIP/flow efficiency, predictability), and business impact (feature adoption).
Start small: pick 5 KPIs, define them in plain language, automate collection, and review trends on a consistent cadence. Expand later, only after the first set is driving better decisions.
Need help with software development KPIs? Explore our CTO as a Service or browse our recent projects.
Last updated: 05 Feb, 2026
